
In September 2023, Microsoft announced the public preview of Python integration in Microsoft Excel, available to Enterprise, Business, Education, and Family and personal users who are part of the Beta Channel on Windows. The initial rollout will focus on Excel for Windows, beginning with build 16.0.16818.20000, followed by other platforms in due course.
So, what is this integration?
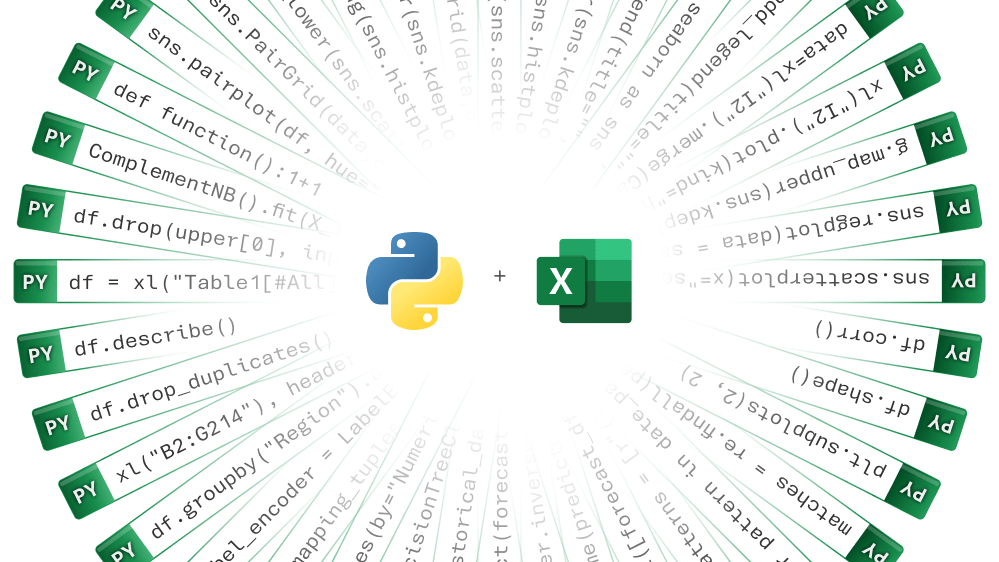
Python and Excel are two powerhouses in data manipulation and analytics and have historically operated in parallel universes. Now, for the first time, Microsoft is bringing them together in a seamless and secure manner. The integration of Python into Excel has the potential to amplify your data analytics. Users will be able to engage with Python’s versatile libraries for data analysis and visualisation alongside Excel’s tried-and-true features like formulas, charts, and PivotTables. Python can be used to manipulate and examine data, and Excel functions can be leveraged to demonstrate findings. All of this is available without additional setup or installation requirements, and users can access the Python functionalities without leaving Excel.
Microsoft has announced that this integration is in partnership with Anaconda, a leading enterprise-grade Python distribution platform used globally by data practitioners. This partnership ensures that Python in Excel is backed by Anaconda’s rich library ecosystem, featuring top libraries like pandas, statsmodels, Matplotlib, and seaborn. The Python code runs securely on Microsoft Cloud, ensuring data meets enterprise-level security and compliance requirements.
Opportunities for collaboration
Python-augmented Excel workbooks can be shared and transferred effortlessly across popular Microsoft tools like Teams and Outlook. This allows for seamless collaboration with features like comments, @mentions, and real-time co-authoring. Even team members without Python activated can refresh analytics for the most up-to-date insights.
This integration is designed to support everything from visualisation and data cleaning to machine learning and predictive analytics. Excel users can now construct end-to-end solutions, blending the capabilities of Python and Excel using the tools they are already accustomed to. Whether it’s bar graphs or complex heatmaps, this integration uncovers various charting libraries and data cleaning techniques such as locating missing values, standardising formats and removing duplicates.
You can read more about the announcement here: https://techcommunity.microsoft.com/t5/excel-blog/announcing-python-in-excel-combining-the-power-of-python-and-the/ba-p/3893439